
How we built an intelligence layer on top of legacy data systems

90%
Backtested accuracy, against a 75% target
~40%
Estimated revenue gain, had it been followed
15 days
Forecast horizon, plus a stockout date
TL;DR
Every sales and inventory question at Levels was answered twice: once in a chat from a POS screenshot, once in the POS.
AxiaOS added one data layer and a forecasting agent on Amazon Chronos-Bolt through AWS Bedrock, fine-tuned per store.
Backtested January to May, it held roughly 90% accuracy against a 75% target.
Before AxiaOS, every sales and inventory question at Levels started with a screenshot of the POS, pasted into a chat, then checked back in the POS. We replaced it with an intelligence layer on top of the legacy software systems Levels already ran — one place where inventory, vendor and sales history live, and a forecasting agent that predicts what each top product will sell over the next seven and fifteen days.
The challenges
Ordering ran fully manually through the POS, against two goals nobody had tooling to support: keep the SKUs that sell in stock, and flag or discount the ones that do not.
Every answer cost the time twice
Screenshot the POS, feed it to a chat, then re-check the POS to confirm the output.
Demand prediction lived in one person’s head
There was no forecasting layer, only staff experience and a set of Google Sheets.
Leftover stock could not be read either way
Stock on the shelf might mean the product was over-ordered, or that it sold out early and the shelf refilled late.
What we built
AxiaOS has been running at Levels since May 2026, built in two parts: getting inventory data into one place, then predicting it.
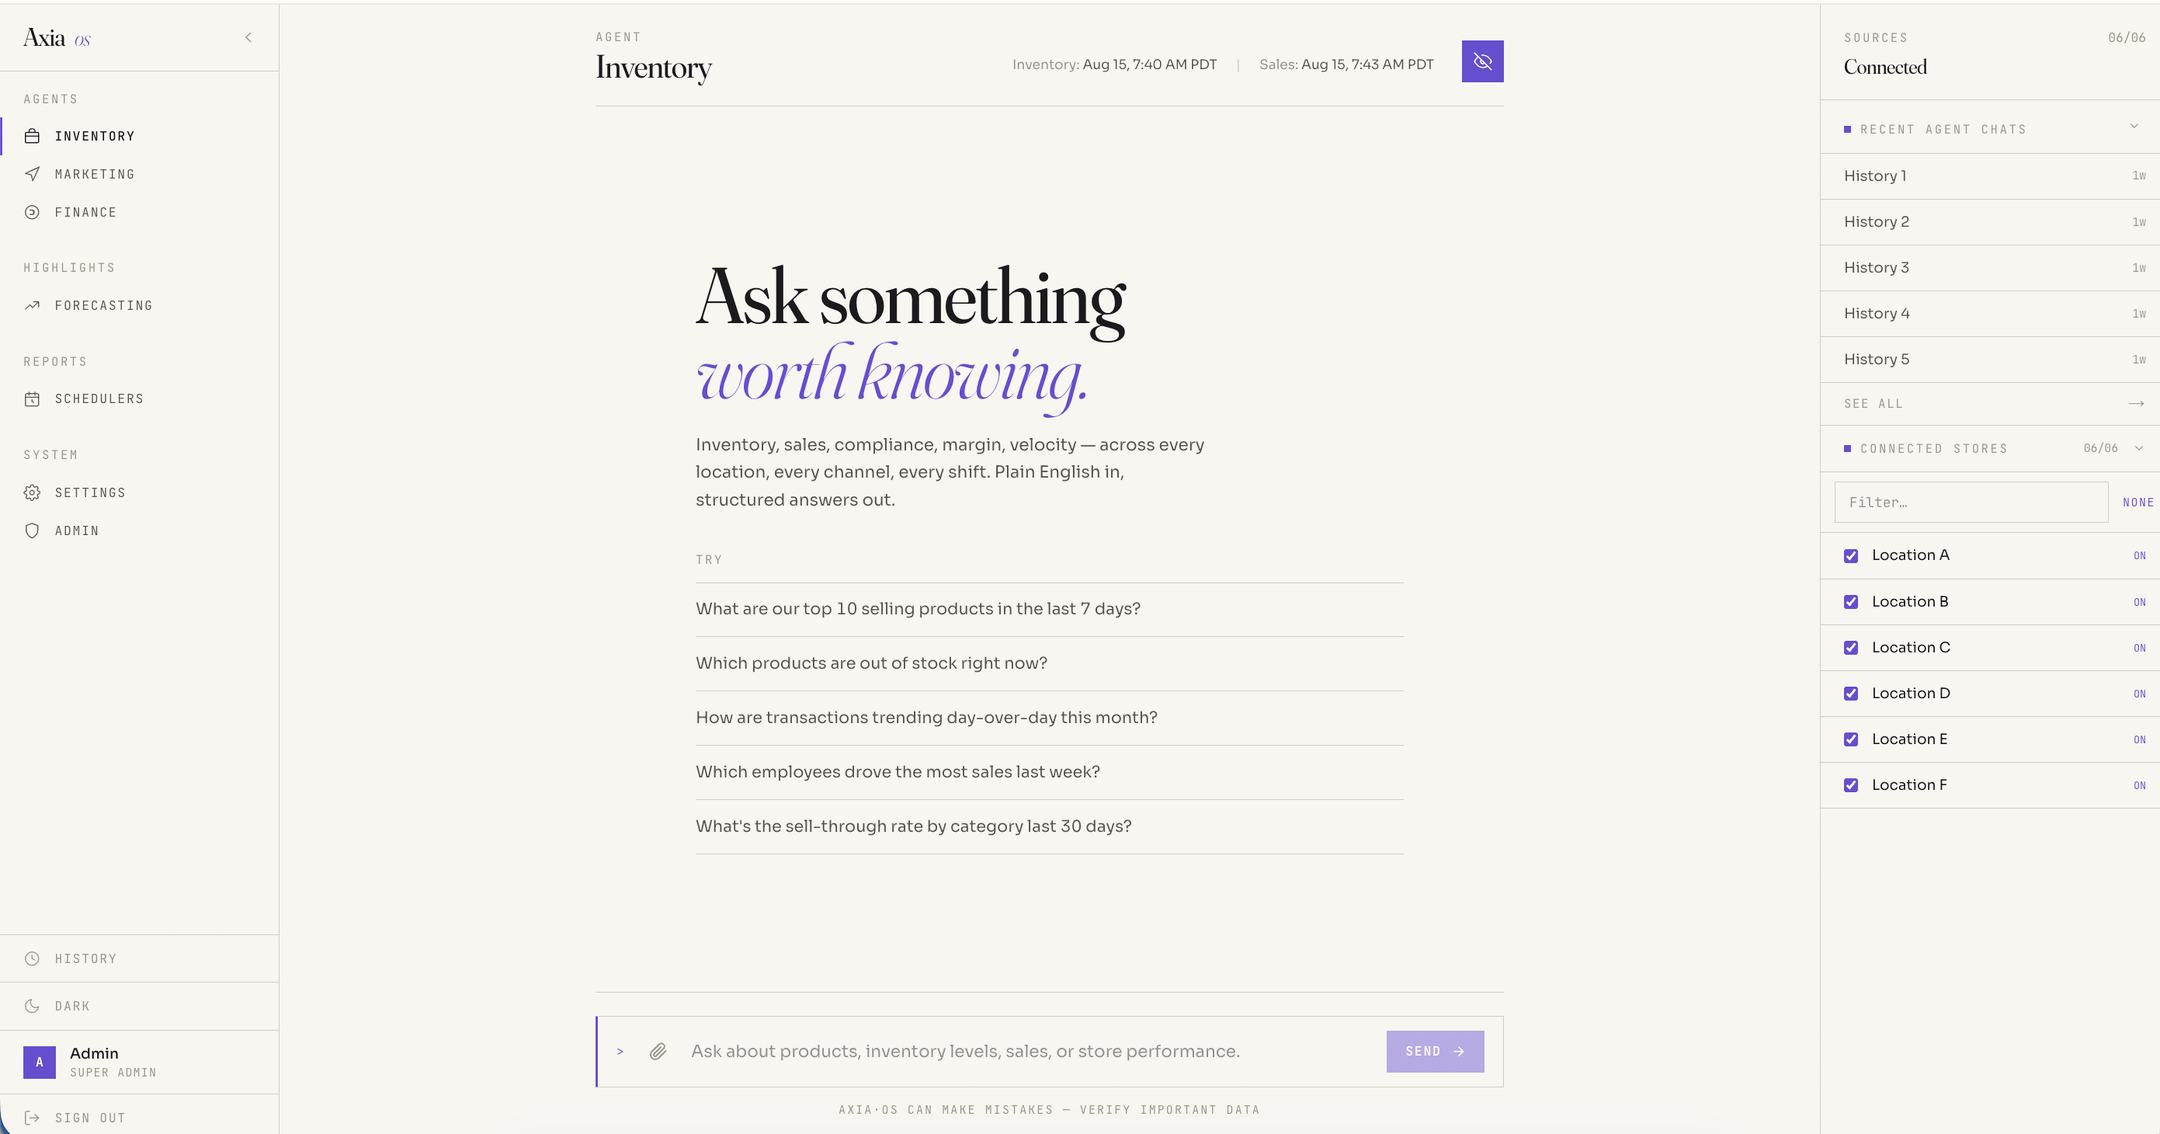
One place for inventory, vendors and sales history
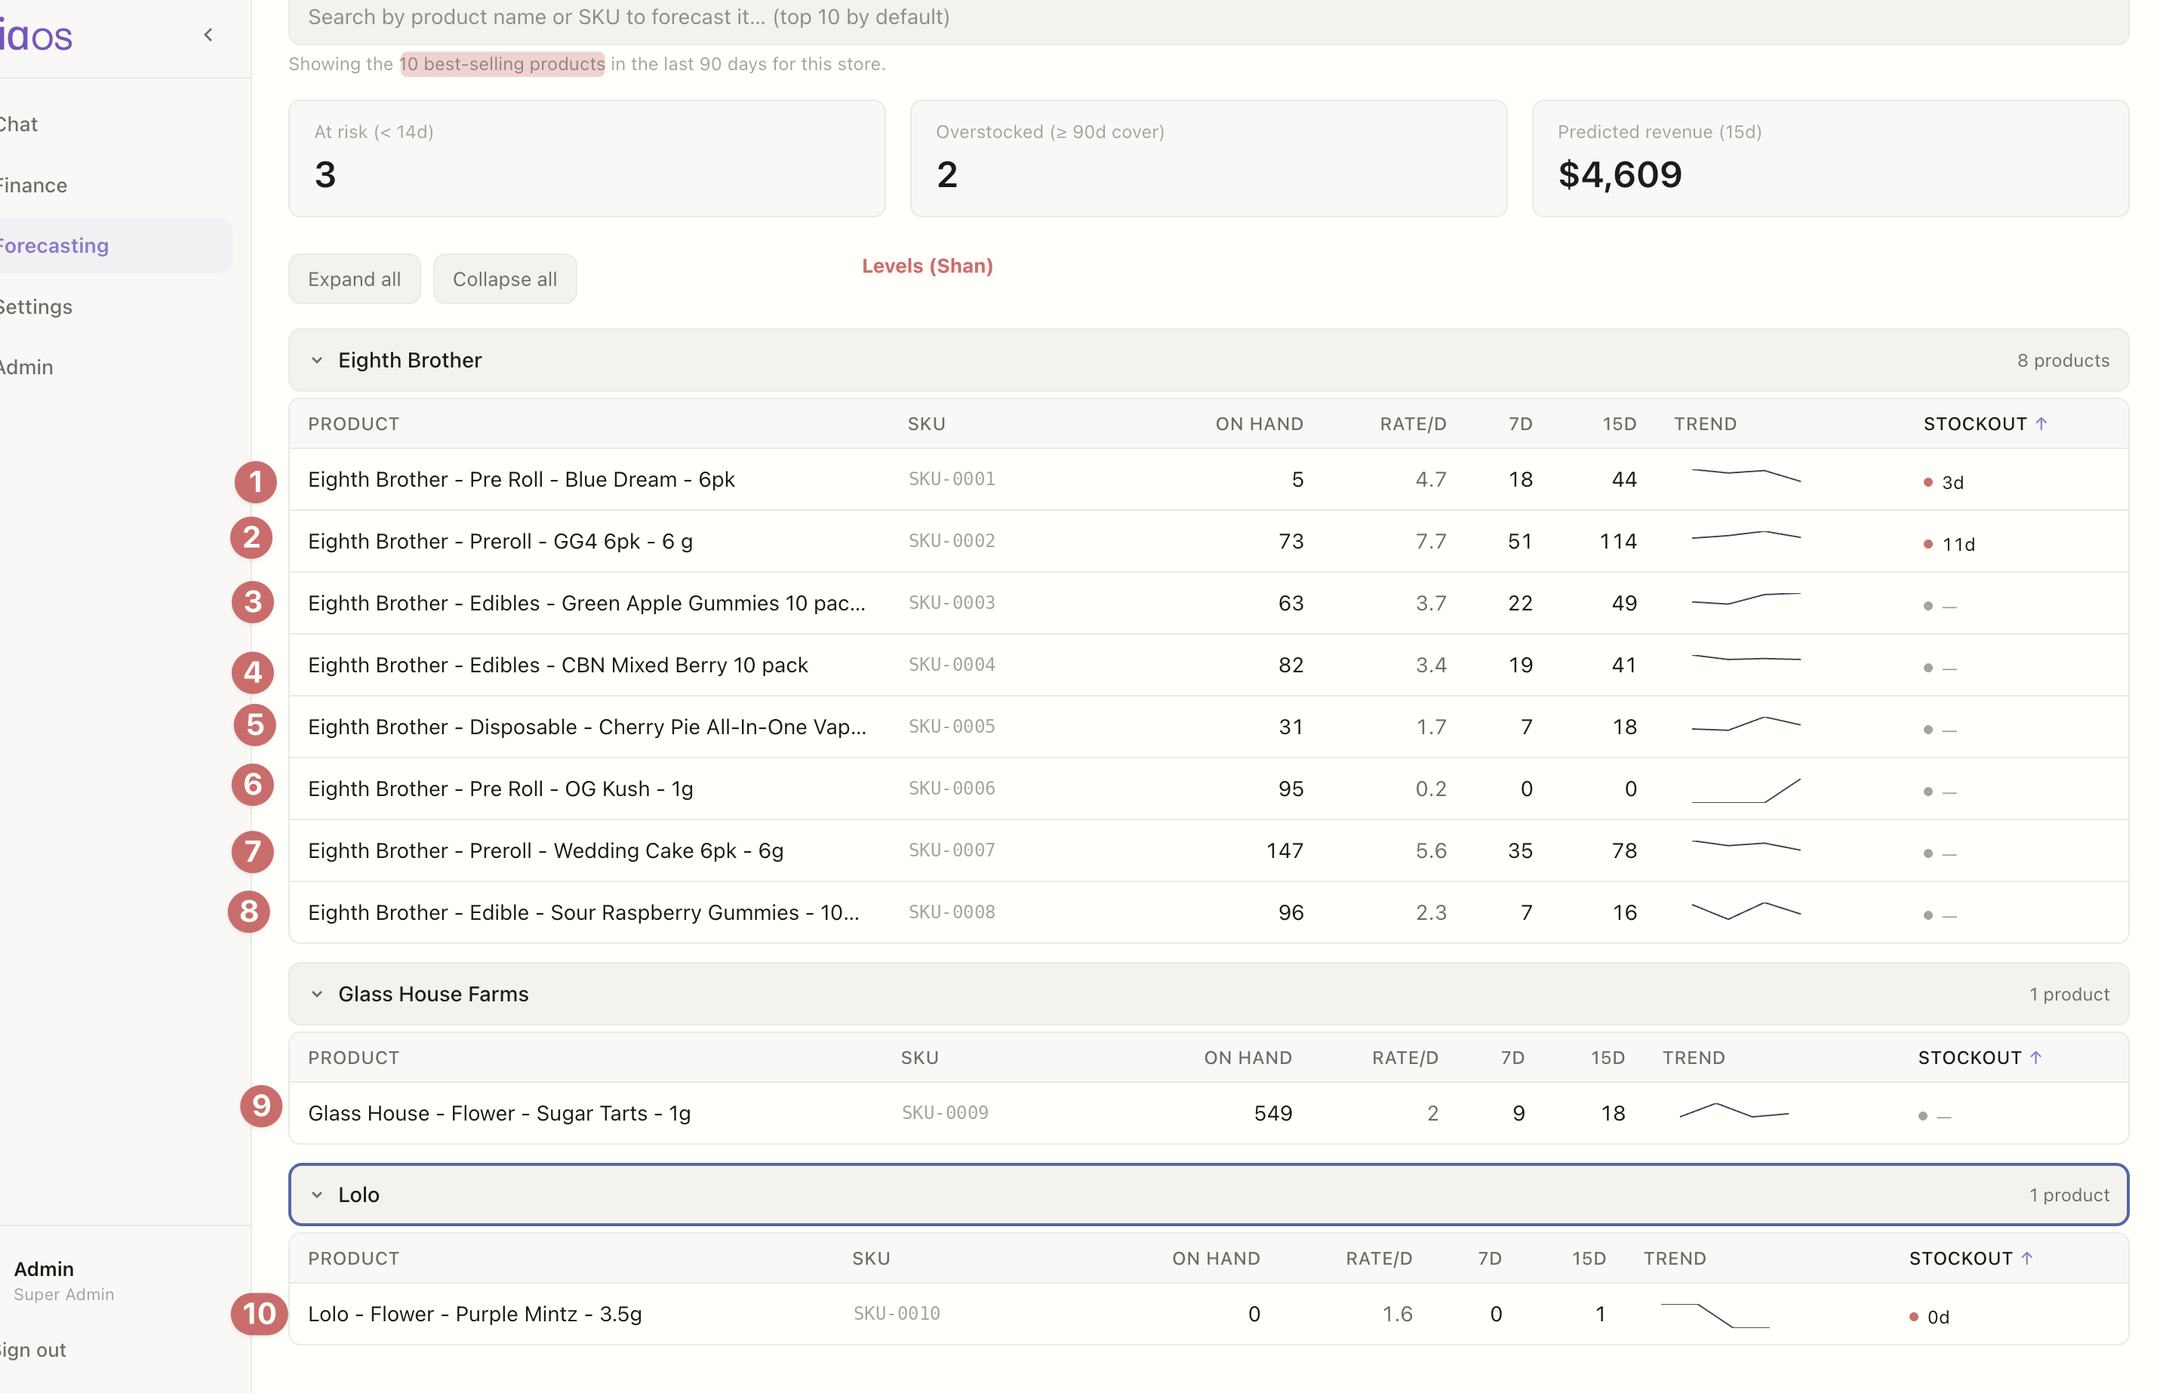
Forecasting the top products, seven and fifteen days out
SQL selects the cohort by recent velocity, excluding voids and returns
The series is densified into a 28-day daily array and divided by its own mean
One batched Bedrock call returns 15-day forecasts with quantile bands at 0.1, 0.5 and 0.9
Outputs are un-scaled, and per-row arithmetic produces the 7-day and 15-day forecasts and days to stockout
The response is cached for ten minutes
The denominator that was under-ordering the best sellers
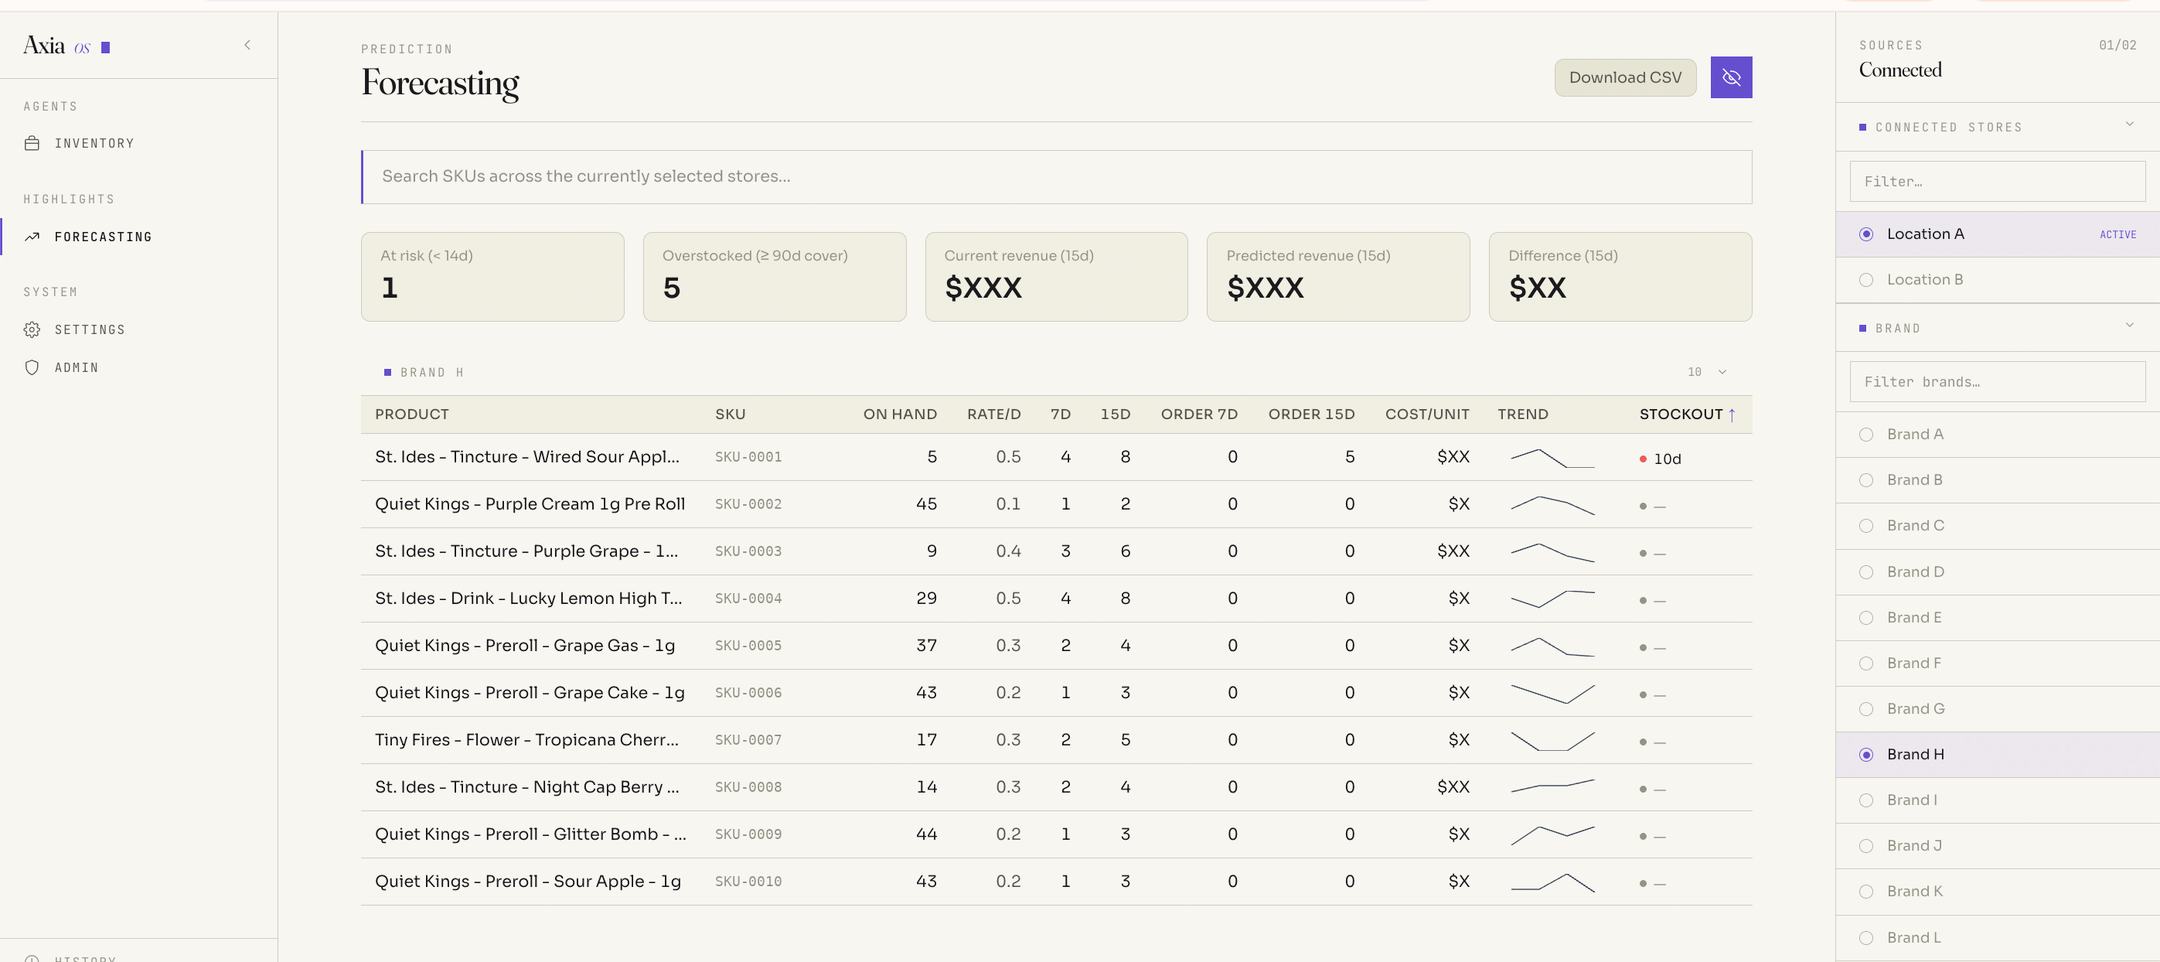
From a forecast to a drafted purchase order
“The forecast has extremely accurate. It’s caught stockouts before we would have seen them coming.”
Levels Dispensary
Conclusion
Ordering moved from a from-scratch process to review and approve. The engagement grew into Marketing and Finance agents, a scheduling layer and connectors into Gmail, Klaviyo and OmniSend. The days-in-stock fix, the substitution logic and the order-draft workflow shipped as platform capability, now in use by other operators.
Want an intelligence layer over your own legacy IT systems? Get in touch.
90%
Backtested accuracy, against a 75% target
~40%
Estimated revenue gain, had it been followed
15 days
Forecast horizon, plus a stockout date
POS: Blaze | Compliance: Metrc
Forecasting model: Amazon Chronos-Bolt via Bedrock InvokeModel, fine-tuned per store on a 28-day window
Method: mean-scaled series, quantile bands at 0.1 / 0.5 / 0.9, in-stock days only
Outputs: 7-day and 15-day forecast, days to stockout, suggested order quantities, cost per unit, CSV export
Agents: Inventory, Marketing, Finance | Connectors: Gmail, Klaviyo, OmniSend
FAQ
How do you build an AI inventory forecasting agent for a cannabis retailer?
Get the data into one place first, then forecast on top of it. At Levels, SQL pulls each top product’s daily sales, the series is mean-scaled over 28 days, and Chronos-Bolt on AWS Bedrock returns 15-day forecasts that become a stockout date against on-hand stock.
Which model powers the forecast?
Amazon’s pre-trained time-series model, Chronos-Bolt, called through Bedrock and fine-tuned on each store’s own sales history.
How do you stop a forecast from under-ordering best sellers?
Measure sell-through over days in stock rather than calendar days, so stockout periods drop out. A product that sells out in seven days then reads as a seven-day sell-through.
How accurate is it?
Backtested daily against actual sales from January through May, it held roughly 90% accuracy and occasionally 95%, against a beta target of 75%. See what we learned deploying AI agents in production.
What are some examples of legacy systems an AI agent can sit on top of?
Common legacy systems examples in retail are a point-of-sale and a stack of spreadsheets — at Levels, a Blaze POS and a set of Google Sheets. Each records what happened but was never built to predict what sells next, which is where an intelligence layer and a forecasting agent add the missing view.
Read more


